HFT-Driven Liquidity Warfare on Bitcoin
Welcome to the omega zone — the layer of the market where milliseconds matter, and liquidity isn't just hunted — it’s engineered.
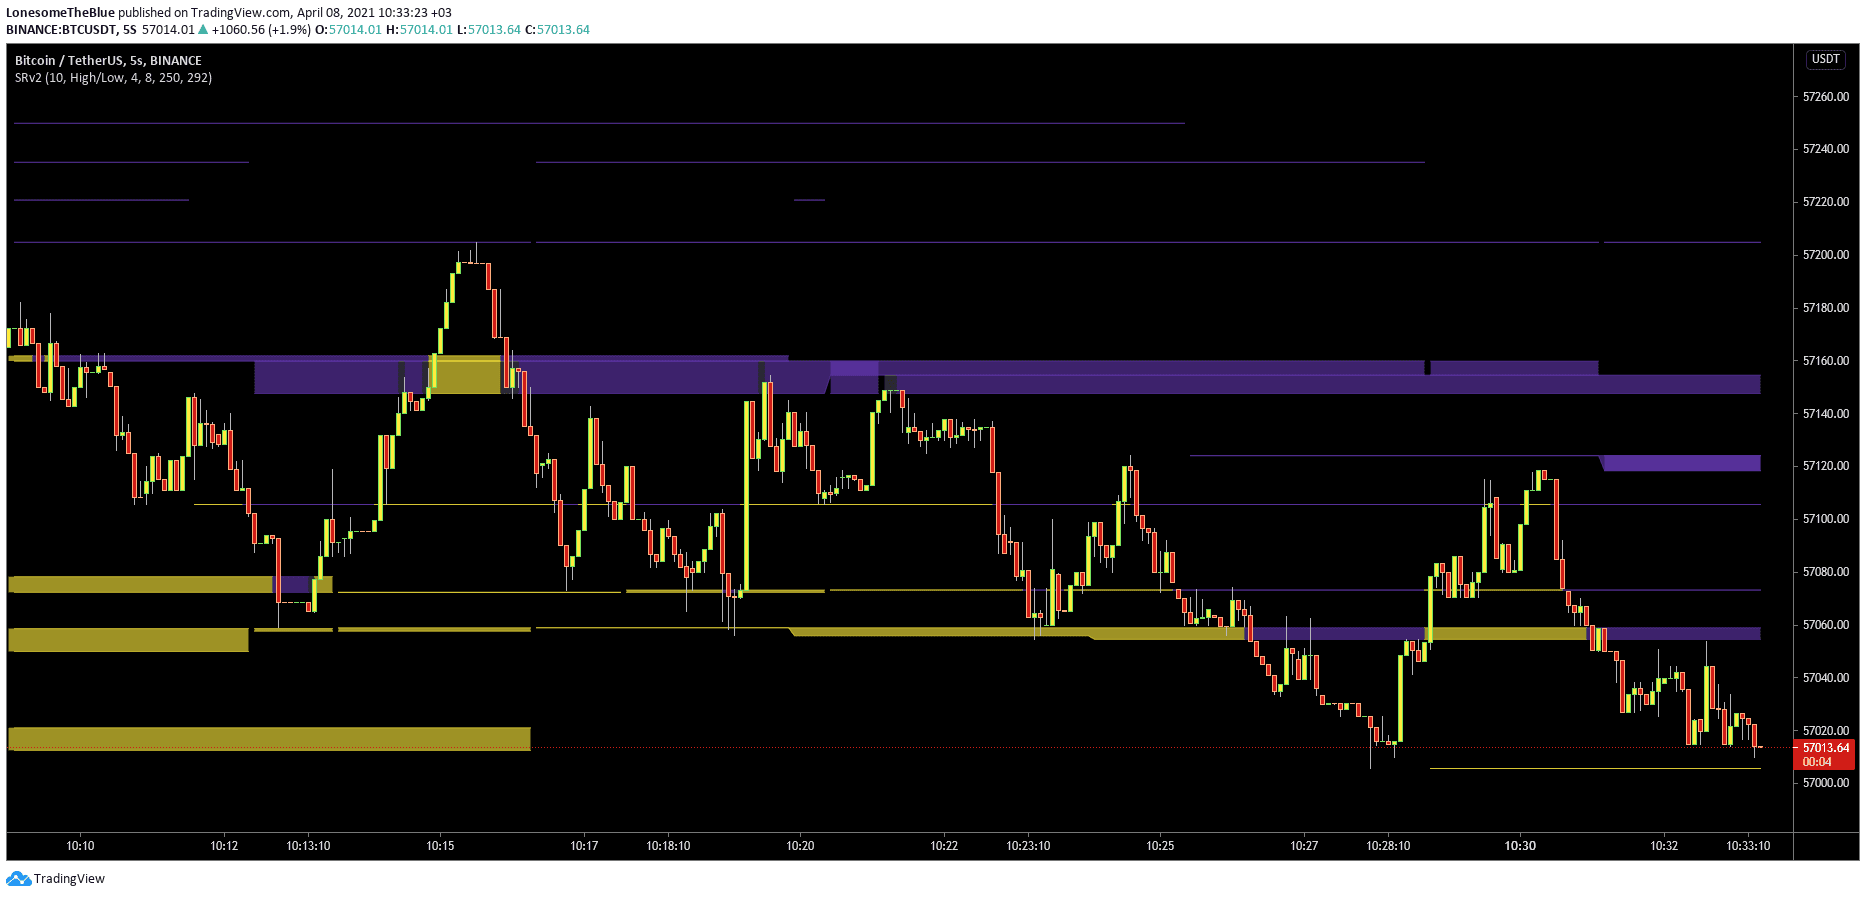
This 5-second BTC/USDT chart, enhanced by SRv2 liquidity zones, isn’t a normal view. It’s how machines see the market. It’s how smart liquidity algorithms bait, flip, and liquidate retail and algos in less time than it takes to blink.
Let’s dive in.
⚙️ Technical Overview
- Chart Type: Candlestick, 5-second interval
- Platform: Binance via TradingView
- Indicators: SRv2 (Support-Resistance Zones, High/Low Clustering Engine)
- Zones:
- 🔵 Purple Zones = Sell-side liquidity walls (supply clusters)
- 🟡 Yellow Zones = Buy-side demand (order block absorption zones)
🔍 Microstructure Flow Breakdown
1. The Opening Fade (Left of Chart)
- A textbook liquidity trap begins below a purple SRv2 band
- First impulsive move is a downward liquidity grab → price pierces yellow demand
- Rebounds hard into supply — but look closely:
- The first purple zone absorbs buys, initiates mean reversion
📌 Smart Money Behavior: Run stops → fake breakout → mean revert
Result: Retail longs get trapped above resistance
2. The Mid-Chart Deception: Engineered Euphoria
- Price spikes, breaking through purple supply temporarily
- Yellow demand zone thrusts price up — high volatility imbalance
- But look at the wick rejection:
- False breakout engineered to lure momentum bots and breakout chasers
- The move sharply reverses — not organically, but because limit sell walls above were filled
📌 Market Intel: When price spikes without consolidation, assume exit, not entry by institutions
3. Reaccumulation or Redistribution?
- Price hovers between two SRv2 cluster zones
- The tight compression shows market indecision — common before expansion or flush
- Watch the central yellow zone:
- It acts as a micro OB, absorbing sell-side pressure
- Fake upside movement begins again... and dies
📌 Lesson: The middle of the chart is not direction — it’s inventory balancing
4. Algorithmic Liquidation Sweep (Right Side)
- Final spike up is a liquidity hunt into resistance
- Price breaks through lower yellow demand on high velocity
- Stop-loss zones flushed
- As it pulls down, no new buyers defend previous lows
📌 Observation: This is how HFTs and market makers clear weak hands before range rotation
🔑 Key Institutional Takeaways
| Insight | Application |
|---|---|
| SRv2 Zones Reflect Real-Time Liquidity Intent | Front-run engineered traps, don’t trade levels blindly |
| Fast Reversals After Spikes | Are not trend changes — they are stop-hunts |
| Absorption Candles at Key Zones | Confirm presence of whales, MM inventory building |
| Price Reaction vs. Price Level | Read the reaction, not the location — algorithms are reactive, not predictive |
Products
Knowledge Hub
© NextBull 2025